Correlation analysis is a practical method for identifying hidden concentrations inside an investment portfolio. Many portfolios appear diversified because they contain multiple funds, sectors, or asset classes. However, if these holdings move in similar patterns, the portfolio may remain exposed to the same underlying risk. Using correlation analysis tools allows investors to quantify these relationships and make structural adjustments based on observable data rather than assumptions based on labels or marketing descriptions.
Understanding Correlation in Portfolio Management
Correlation measures how two assets move relative to each other. It is typically expressed on a scale from -1 to +1. A value close to +1 indicates that two assets tend to move together in the same direction. A value near -1 suggests they move in opposite directions. A correlation around 0 implies there is no consistent linear relationship in their return patterns over the selected time frame.
In portfolio management, correlation plays a central role in assessing diversification. Diversification is not simply the act of holding numerous positions. Instead, it is the practice of combining assets whose return behaviors differ enough to reduce the overall variability of portfolio returns. If multiple holdings consistently rise and fall together, they may amplify volatility rather than offset it.
Hidden concentration occurs when multiple holdings have high positive correlation. For example, an investor may allocate capital across several exchange-traded funds, mutual funds, and individual equities, believing the number of line items ensures diversification. However, if these securities are all influenced by the same growth factor, monetary policy trends, or sector-specific drivers, the effective exposure may be concentrated. Holdings tied to similar supply chains, consumer segments, or financing conditions often display this form of structural overlap.
The distinction between apparent diversification and functional diversification becomes clearer when returns are examined statistically. Two funds categorized differently by geography or sector may still exhibit strong correlation if they respond similarly to global liquidity conditions or investor risk appetite. Measuring correlation provides a transparent method of testing whether diversification assumptions are supported by actual performance behavior.
Using Correlation Matrices
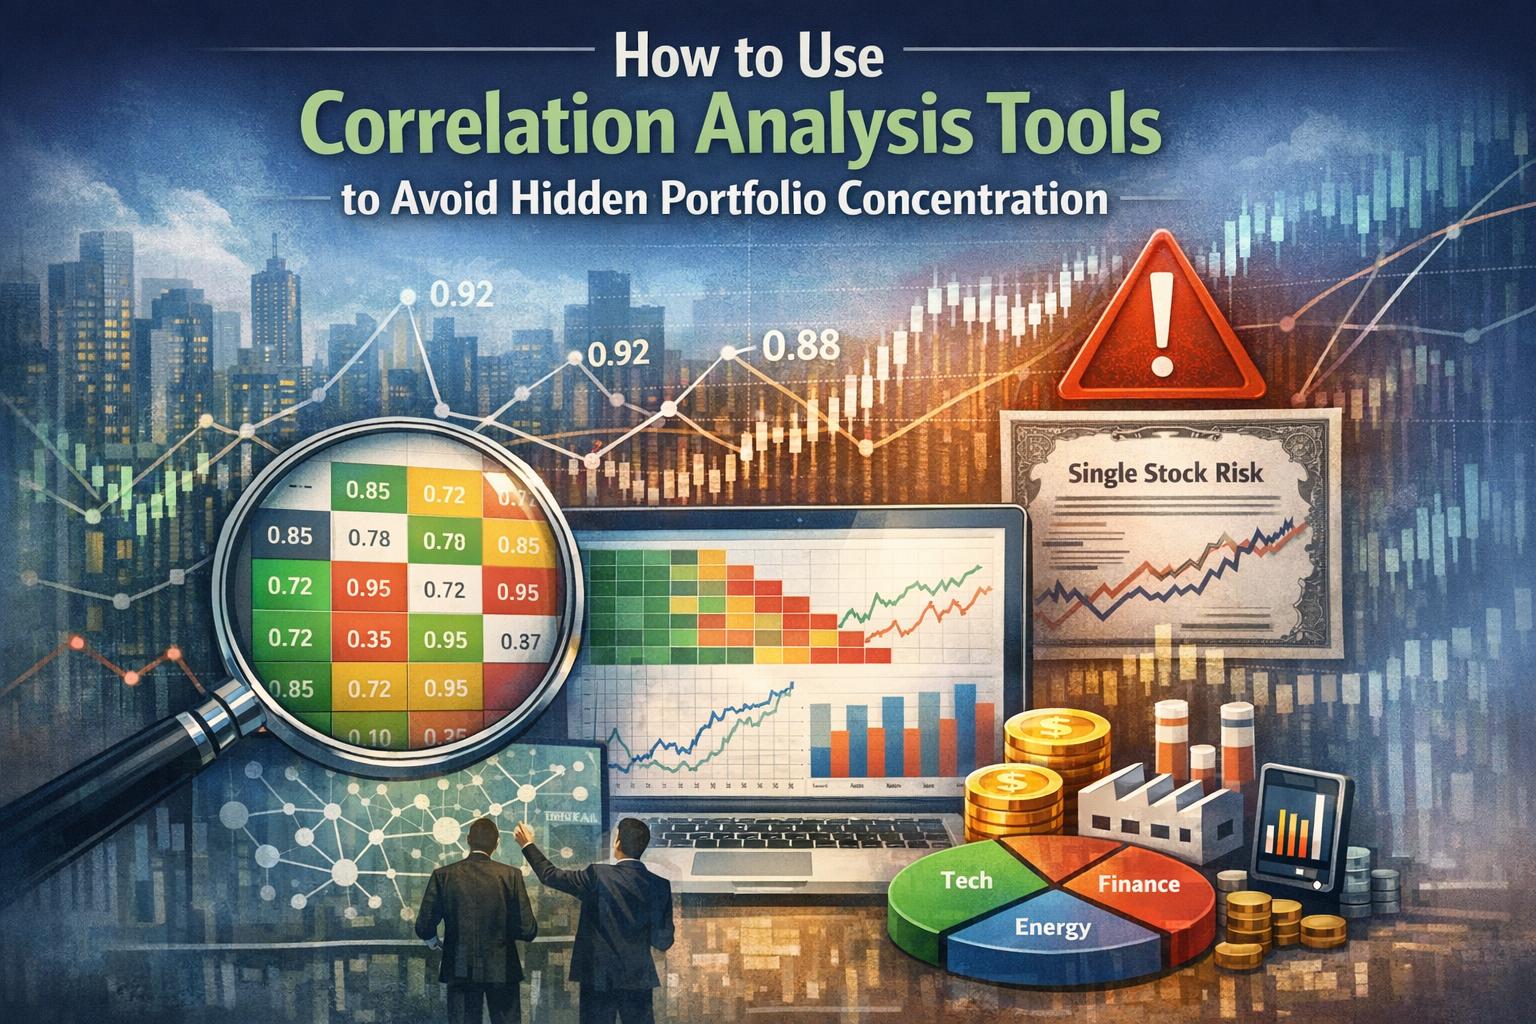
A correlation matrix is one of the most direct tools for detecting concentration risk. This matrix presents correlation coefficients for each pair of assets within a portfolio. Modern portfolio analytics platforms, statistical software packages, and advanced spreadsheet applications can calculate correlations using historical return data. Once calculated, the matrix allows investors to identify clusters of assets that move together.
When interpreting a correlation matrix, consistently high values across multiple asset pairs may signal structural alignment in performance drivers. Coefficients above approximately 0.70 often indicate strong co-movement, particularly when observed across multiple time periods. If a group of equities, funds, or asset classes displays uniformly high correlations, they may represent a concentrated exposure despite differences in branding or benchmark comparison.
Correlation matrices also become particularly informative during periods of market instability. Rising correlations across previously distinct assets can signal that diversification benefits are diminishing. For example, equities across various regions may behave independently during stable conditions but converge in times of global stress. Observing such dynamic shifts can inform decisions about whether the portfolio structure remains aligned with risk objectives.
It is important to calculate correlations across multiple time horizons. A short lookback period may reflect temporary dislocations or unusual events, while longer periods may capture structural relationships more accurately. Investors often analyze one-year, three-year, and five-year rolling windows to understand both short-term fluctuations and persistent patterns. Consistency across multiple horizons may suggest long-term structural exposure, whereas divergence between periods may indicate cyclical factors.
Factor Exposure and Hidden Concentration
Correlation frequently reflects shared exposure to risk factors. Risk factors are systematic drivers that influence groups of securities simultaneously. Common examples include overall market beta, interest rate sensitivity, inflation expectations, commodity price movements, and credit conditions. Assets influenced by the same factors may demonstrate high correlation even if they appear unrelated on the surface.
For instance, a technology company and a consumer discretionary firm may operate in different industries but both rely heavily on economic expansion and access to capital markets. If economic growth slows or financing conditions tighten, both companies may respond similarly. Their returns would therefore exhibit positive correlation driven by shared sensitivity to macroeconomic conditions rather than sector overlap alone.
Factor analysis extends correlation analysis by decomposing returns into underlying components. Instead of examining only pairwise relationships, factor models estimate how much of each asset’s return is explained by systematic influences such as market exposure, size characteristics, value orientation, momentum, or interest rate duration. When several portfolio holdings display similar factor loadings, this signals hidden concentration at a deeper structural level.
Combining correlation matrices with factor analysis offers a more comprehensive view. Correlation reveals the observable relationships in historical returns, while factor analysis clarifies the economic mechanisms behind those relationships. An investor may discover that multiple international equity funds share similar exposure to global growth factors, or that bond funds with different maturities share sensitivity to interest rate movements. Such insights allow more precise adjustments than simply reducing the number of holdings.
Asset Allocation and Structural Overlap
Asset allocation decisions are often made using broad categories such as equities, fixed income, real assets, and alternatives. However, correlation analysis can reveal that assets within different categories are more closely linked than assumed. Corporate bonds, for example, may correlate with equities during economic downturns because both respond to credit risk perceptions. Similarly, real estate investment trusts may move in line with equity markets due to shared sensitivity to financial conditions.
International diversification may also appear stronger than it is. Global financial markets are increasingly integrated, and multinational corporations operate across borders. As a result, regional equity indices can exhibit high correlation, particularly during global events. Currency exposure may introduce differentiation, but if currency risk is hedged, correlations may increase further.
Identifying these linkages is essential for maintaining a balanced allocation. Correlation analysis does not suggest avoiding assets with positive relationships. Instead, it provides visibility into the degree of overlap. Investors can then determine whether the observed relationships align with their intended strategic allocation or whether adjustments are warranted to distribute exposure more effectively across independent risk drivers.
Monitoring Correlation Over Time
Correlation is not constant. Market structure, regulatory environments, technological developments, and macroeconomic trends all influence how assets interact. During stable periods, diversification benefits may appear reliable. In contrast, market stress often compresses correlations as investors adjust risk exposures broadly.
Rolling correlation analysis calculates correlation coefficients over moving time windows, such as trailing twelve-month periods updated monthly. This technique allows investors to observe whether relationships are strengthening or weakening. A steady rise in correlations across numerous holdings may indicate growing concentration risk, even if the number of asset categories remains unchanged.
Changes in monetary policy are one example of drivers that can alter correlations. When interest rates are near zero, equity and bond markets may respond similarly to monetary stimulus. When rates rise rapidly, fixed income and equity markets may decouple or, in some cases, decline together if policy shifts affect growth expectations. Continuous monitoring enables investors to respond to these structural changes rather than relying solely on historical averages.
Practical Implementation Steps
Correlation analysis can be implemented through systematic processes. First, investors gather consistent historical return data for each holding. Returns should be calculated at the same frequency, such as monthly intervals, to ensure comparability. Adjustments for dividends, distributions, and splits ensure accurate measurement.
Next, pairwise correlations are calculated across all holdings. The resulting matrix is reviewed for patterns. Clusters of high correlation are examined in greater detail to determine whether they stem from sector overlap, shared factor exposure, or macroeconomic sensitivity. Visual tools such as heat maps can assist in identifying areas where concentrations appear most pronounced.
After identifying areas of overlap, the investor evaluates whether the observed relationships are intentional. Some concentrations may reflect deliberate positioning based on strategic views. In such cases, correlation analysis serves as confirmation of exposure magnitude. If the concentration is unintended, adjustments may involve reallocating funds to assets with lower correlation or introducing strategies designed to respond differently to economic variables.
Rebalancing decisions should be grounded in data rather than assumptions about geographic or sector diversification. For example, a portfolio containing domestic growth equities, international developed market funds, and emerging market ETFs may still function primarily as a global equity beta allocation. If correlations among these holdings remain persistently high, the portfolio’s performance may largely depend on global equity conditions. Recognizing this structural reality supports more informed allocation adjustments.
Integrating Correlation with Risk Metrics
Correlation analysis becomes even more informative when integrated with other risk measures. Portfolio volatility, value at risk, and drawdown statistics all depend on how assets interact. The covariance structure of returns, derived from correlation and standard deviation, directly influences modern portfolio theory calculations of efficient frontiers and optimal allocations.
By adjusting correlation inputs, investors can model how portfolio risk changes under different structural scenarios. Increasing allocation to assets with low or negative correlation may lower overall volatility, while adding highly correlated assets can increase sensitivity to specific economic shocks. Analytical frameworks that combine expected return assumptions with correlation structures provide a systematic approach to risk budgeting.
It is important to consider estimation error when using historical data. Correlation coefficients can vary depending on the sample period, frequency of data, and presence of outlier events. Employing longer data series, stress scenarios, and conservative assumptions may reduce the likelihood of overestimating diversification benefits.
Limitations of Correlation Analysis
Although correlation analysis is a valuable diagnostic tool, it has limitations. It is based on historical observations and assumes that relationships observed in the past may inform the future. Structural economic transitions, regulatory changes, or shifts in market participation can alter asset behavior. As a result, past correlation patterns may not fully predict future dynamics.
Correlation measures linear relationships and may not capture complex nonlinear interactions. In certain market environments, assets may appear uncorrelated during moderate conditions but react similarly under extreme stress. This phenomenon highlights the need to complement correlation analysis with scenario testing and stress simulations that model extreme outcomes.
Data quality also influences results. Short time frames, infrequent pricing data, or illiquid securities can produce unstable estimates. Ensuring consistent, high-quality data improves reliability. Additionally, interpretation requires context. A high correlation between two defensive assets may have different implications than a high correlation between two volatile growth assets.
Effective diversification depends on behavior rather than classification. Correlation analysis offers a structured method for examining how assets actually move relative to one another. When applied consistently, evaluated across multiple time horizons, and integrated with factor analysis and broader risk metrics, it enables investors to identify hidden concentrations and align portfolios more closely with defined risk objectives. Through disciplined monitoring and measured adjustments, correlation analysis supports evidence-based portfolio construction and ongoing risk management.