Comparing exchange-traded fund (ETF) overlap is an important step in building a diversified portfolio. Two funds with different names, investment mandates, or index providers can still hold many of the same underlying securities. Without careful review, investors may assume they have broader exposure than they actually do. Measuring ETF overlap provides clarity about how capital is allocated across individual companies, sectors, industries, and geographic regions.
Modern portfolio construction increasingly relies on ETFs to gain efficient access to markets. Because ETFs are structured to track specific indexes or themes, their holdings are publicly disclosed on a regular basis. This transparency allows investors to perform detailed analysis of portfolio composition. By comparing holdings across ETFs, it becomes possible to identify duplication, concentration, and unintended risk exposures.
Why ETF Overlap Matters
ETF overlap occurs when two or more funds in a portfolio hold identical or substantially similar securities. This duplication can be measured at the company level, sector level, or even by broader asset class exposure. In portfolios consisting of multiple equity ETFs, overlap frequently arises when funds track related indexes. For example, a U.S. large-cap ETF and a total U.S. market ETF typically share many holdings because large-cap companies represent a significant portion of the total market.
Excessive overlap can reduce effective diversification. If several ETFs allocate significant weight to the same securities, the combined portfolio becomes increasingly dependent on the performance of those shared holdings. This creates concentration risk, meaning that negative performance in a small group of stocks may have a disproportionate impact on overall returns. While concentration is not inherently unsuitable, it should reflect deliberate allocation decisions rather than unintended duplication.
Overlap also affects sector and industry exposure. Even when individual holdings do not perfectly match, similar weighting toward certain sectors—such as technology, healthcare, or energy—can result in correlated performance. Investors seeking to diversify across economic cycles benefit from reviewing both direct security overlap and broader sector alignment.
Another consideration is capital efficiency. Holding multiple ETFs that replicate similar exposures may increase administrative complexity and potentially duplication of management fees, even if expense ratios are modest. Streamlining overlapping positions can simplify portfolio oversight without substantially altering intended exposure.
Understanding Types of ETF Overlap
ETF overlap can take several forms. The most straightforward type is security-level overlap, where two funds hold the exact same company shares. This type of duplication is common among broad index funds. For example, funds tracking different large-cap U.S. indexes often hold many of the same prominent corporations.
A second type is sector overlap. Two ETFs may hold mostly different companies but allocate heavily to the same sector. For instance, separate growth-oriented and broad market funds might both emphasize technology stocks. Although the specific holdings vary, the economic drivers influencing those sectors may be similar, reducing diversification benefits.
A third form is factor overlap. Factor-based ETFs target characteristics such as value, momentum, low volatility, or quality. Even if holdings are not identical, two factor funds may load heavily on similar attributes, creating comparable risk-return profiles. Investors who combine multiple factor strategies should evaluate whether exposures truly complement each other.
Geographic overlap also deserves attention. International ETFs may include significant allocations to the same multinational corporations listed on different exchanges. Additionally, some U.S.-based companies derive meaningful revenue from global markets, further complicating geographic diversification analysis.
ETF Issuer Research Tools
Many ETF providers maintain research tools on their websites that help investors review holdings and compare funds. These tools typically allow side-by-side comparisons of expense ratios, performance history, sector allocations, and top holdings. While comparisons are often limited to funds within the same issuer’s family, they still provide valuable transparency into portfolio composition.
Holdings disclosures are generally updated daily or monthly, depending on the ETF structure. Each disclosure lists constituent securities along with their weight in the portfolio. By examining these reports, investors can identify common positions between funds. Even reviewing just the top ten holdings can provide insight into whether substantial overlap exists.
Issuer materials may also include breakdowns by region, market capitalization, and style category. These summaries offer indirect evidence of potential duplication. For example, if two ETFs both allocate more than 25 percent to a single sector, it may warrant deeper review at the individual security level.
Although manual comparison can be time-consuming, issuer-provided data is authoritative and reflects actual holdings rather than approximations. Investors seeking a high degree of transparency may prefer to work directly with these primary disclosures.
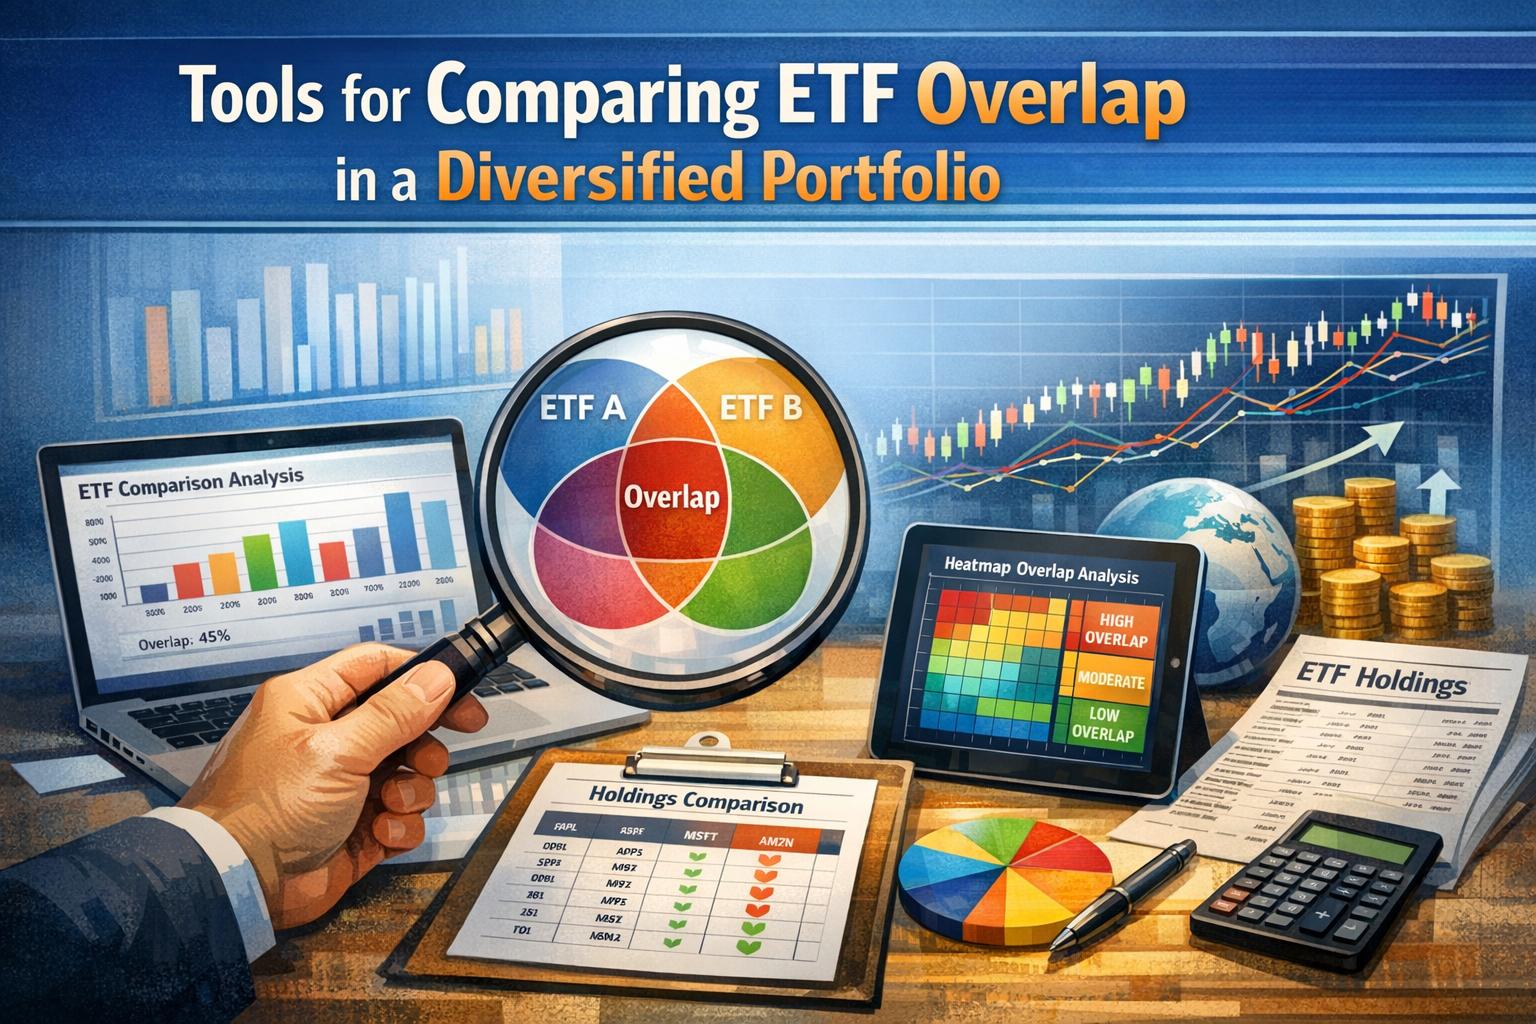
Third-Party Portfolio Analytics Platforms
Independent research platforms expand on issuer tools by allowing cross-provider comparisons. Many of these services incorporate portfolio “look-through” capabilities, meaning they analyze the underlying holdings of multiple ETFs collectively. This functionality enables investors to understand aggregate exposure across an entire portfolio rather than reviewing funds in isolation.
Dedicated overlap tools typically calculate two primary figures: the number of shared securities and the percentage of weight those shared securities represent. The first metric indicates the breadth of duplication, while the second reveals its magnitude. A small number of overlapping holdings can still represent significant exposure if those holdings carry large weights.
Some analytics platforms also provide visualization features, such as heat maps or allocation charts. These graphics help illustrate how securities are distributed across sectors and asset classes. While visual tools can simplify interpretation, the underlying numerical data remains essential for precise evaluation.
Correlation analysis is another commonly available feature. By examining historical price movements, platforms estimate how closely ETFs move in relation to each other. A high correlation coefficient suggests that funds respond similarly to market conditions, even if their holdings differ. Correlation analysis complements holdings overlap by capturing behavioral similarity in performance patterns.
Key Metrics to Review
When assessing ETF overlap, investors usually focus on the percentage of shared holdings. This measure identifies how many identical securities exist in both funds relative to their total number of holdings. For example, if two ETFs each hold 500 stocks and share 100 of them, the shared holdings percentage is significant from a breadth perspective.
An even more informative measure is weighted overlap. Weighted overlap accounts for the relative size of each shared position within both funds. If the overlapping securities represent a large proportion of each ETF’s assets, the effective overlap may be substantial even when the total number of shared holdings is modest.
Sector allocation comparisons help detect indirect duplication. Suppose one ETF focuses on growth stocks while another tracks a broad index. If both allocate a high percentage to the same sector, portfolio volatility may be influenced by common economic drivers. Comparing sector weights side by side clarifies these exposures.
Correlation coefficients provide an additional layer of analysis. A coefficient close to 1 indicates that funds tend to move in the same direction and magnitude, while a coefficient closer to 0 indicates limited relationship. Evaluating correlations over multiple time periods can reveal whether similarity persists across market cycles.
Using Holdings Data for Custom Analysis
Investors seeking detailed control can download holdings data in spreadsheet format from ETF issuer websites. Combining these datasets within spreadsheet software allows for precise calculations of duplication across multiple funds. This method involves matching securities by ticker symbol or unique identifier and summing their weights across the portfolio.
Custom analysis is particularly useful for portfolios that include thematic, international, or multi-asset ETFs. These funds may have overlapping exposure through depositary receipts, cross-listed securities, or shared parent companies. Spreadsheet-based methods make it possible to standardize naming conventions and ensure accurate matching.
By aggregating weights of shared holdings, investors can calculate total portfolio exposure to specific companies. This approach reveals whether a single company represents an outsized percentage of overall assets when combining several ETFs. Identifying these aggregates supports more deliberate allocation decisions.
Advanced users may incorporate additional data, such as revenue sources or factor scores, to analyze overlap on deeper dimensions. While more complex, such analysis can uncover structural similarities that simple ticker comparisons may miss.
Interpreting Overlap in Different Portfolio Contexts
The significance of ETF overlap depends on portfolio objectives. In a core-satellite structure, some duplication between core funds and satellite allocations may be expected. For example, a broad market ETF may intentionally serve as a base, while sector-specific funds introduce targeted tilts. Overlap in this context may not undermine the strategy if it aligns with planned weightings.
In contrast, investors attempting to achieve geographic diversification may find that global and regional funds significantly overlap in developed markets. Reviewing country-level allocations can reveal whether exposure is overly concentrated in a small number of economies.
Fixed-income portfolios may also experience overlap, particularly when combining aggregate bond funds with more specialized credit or government bond ETFs. Shared holdings in major sovereign issuers or corporate bonds can concentrate duration or credit risk.
Understanding these contextual factors ensures that overlap analysis informs decision-making rather than prompting unnecessary changes. The objective is alignment with strategy rather than elimination of all duplication.
Practical Considerations
Some level of overlap is unavoidable when combining broad index funds. Major companies often comprise a substantial portion of capitalization-weighted indexes, resulting in recurring exposure across multiple ETFs. The key question is whether the aggregate exposure is consistent with risk tolerance and investment policy.
Expense ratios, tax implications, and transaction costs should be reviewed before consolidating overlapping positions. Selling one ETF to streamline exposure may trigger capital gains taxes in taxable accounts. Investors should weigh these considerations against potential efficiency gains.
Portfolio size also influences the relevance of overlap. In smaller portfolios, even modest duplication can meaningfully increase concentration. Larger portfolios may absorb some redundancy without significant impact, although monitoring remains prudent.
Regular review supports consistent alignment with objectives. Annual evaluations, or reviews conducted after material allocation changes, provide opportunities to reassess duplication and sector balance. Markets evolve, indexes rebalance, and portfolio weights shift over time, making periodic analysis necessary.
ETF overlap tools and holdings analysis offer quantitative insight into portfolio composition. By integrating security-level data, sector exposures, weighted overlap calculations, and correlation metrics, investors can construct portfolios that more accurately reflect their diversification goals. Careful analysis promotes informed allocation decisions and clearer visibility into underlying risk exposures.