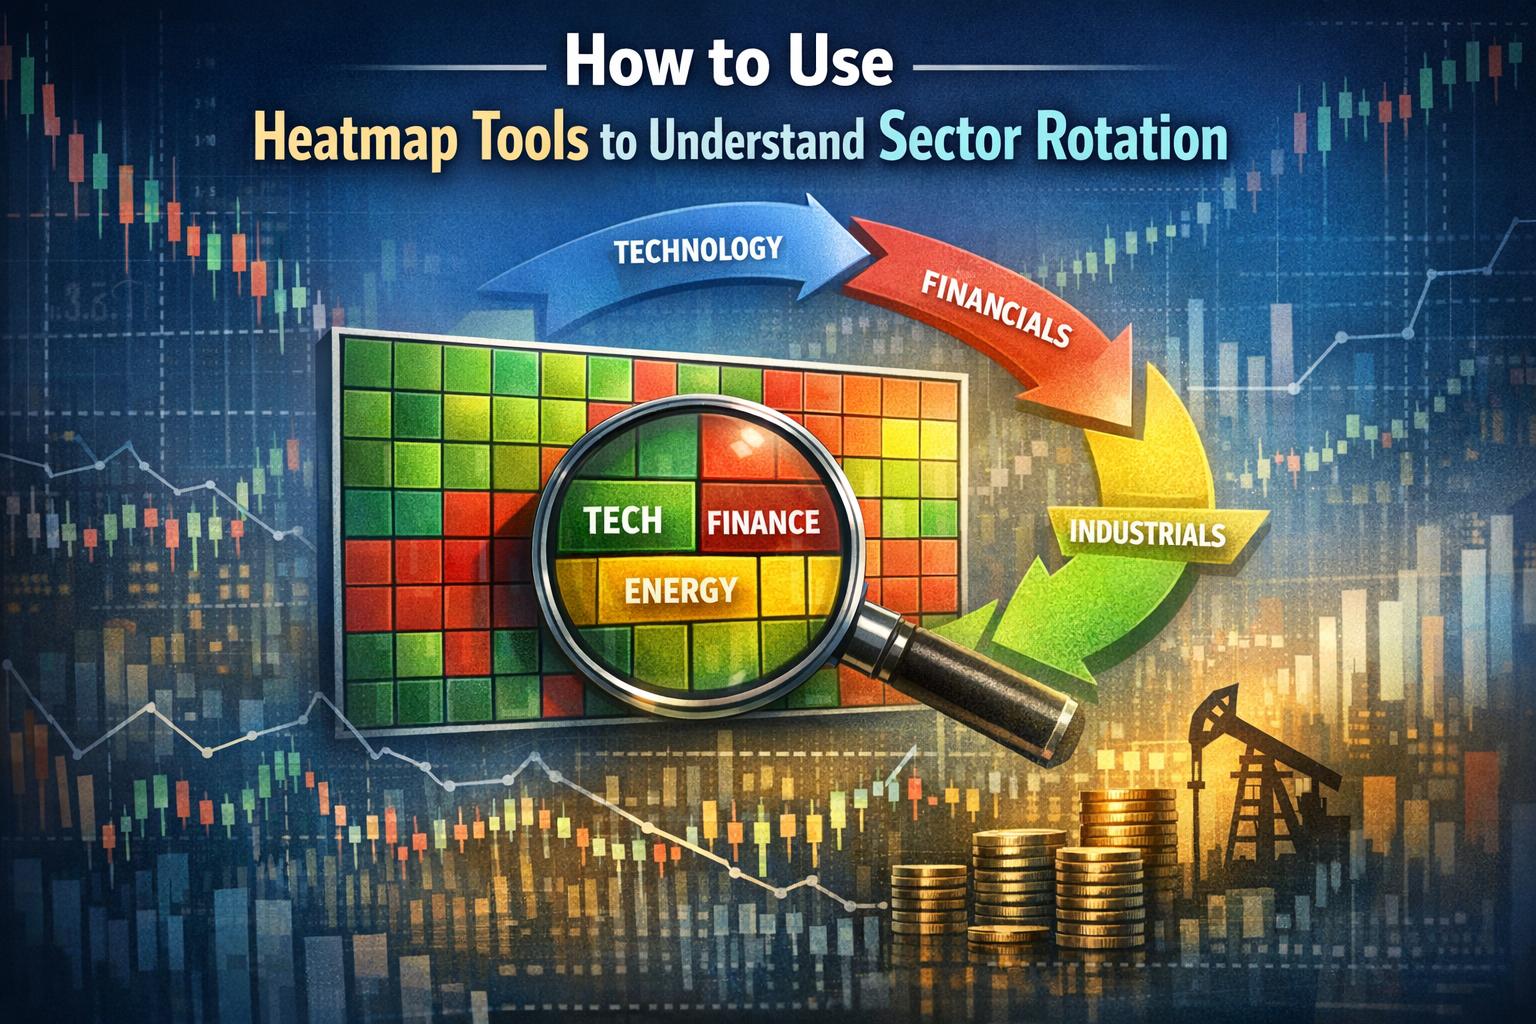
Heatmap tools provide a visual summary of market performance by displaying securities or sectors as colored blocks. The size of each block usually represents market capitalization, while the color indicates performance over a selected period. Investors use these tools to identify patterns in sector rotation, which refers to the movement of capital from one sector of the economy to another during different phases of the business cycle. By compressing a large amount of pricing information into a single visual field, heatmaps allow users to assess broad conditions without reviewing each security individually.
Understanding Sector Rotation
Sector rotation is based on the observation that certain sectors tend to outperform others depending on macroeconomic conditions. Financial markets do not move uniformly. Even when major indexes appear stable, performance often varies significantly beneath the surface. Some industries attract capital while others experience reduced investor interest. These shifts reflect changes in expectations about economic growth, inflation, interest rates, and corporate profitability.
Defensive sectors such as utilities, healthcare, and consumer staples often demonstrate relative stability during economic slowdowns. Their products and services remain in demand regardless of business conditions. In contrast, cyclical sectors such as technology, industrials, energy, and consumer discretionary are generally more sensitive to expansion and contraction in economic activity. When growth accelerates, earnings in these sectors tend to rise more quickly, which may attract capital inflows.
Sector rotation does not imply that one group permanently replaces another in leadership. Instead, leadership alternates over time as macroeconomic conditions evolve. Inflationary pressures may benefit commodity-focused sectors, while falling interest rates may support growth-oriented industries. By recognizing these tendencies, investors attempt to allocated capital in alignment with prevailing trends.
The Economic Cycle and Sector Behavior
The business cycle is commonly divided into phases such as expansion, peak, contraction, and recovery. Although these stages are not precisely defined, they offer a framework for understanding how sectors tend to react. During the early stages of recovery, financial institutions and consumer discretionary companies may benefit from increased borrowing and spending. In mid-expansion phases, technology and industrial sectors often report higher investment activity and capital expenditure. Late-cycle conditions sometimes favor energy and materials, particularly if inflationary pressures build.
When the economy slows, capital often shifts toward sectors considered more stable. Utilities, healthcare providers, and staple goods companies frequently display smaller earnings fluctuations. As a result, their stock prices may decline less sharply during contractions. Heatmap tools enable investors to see these transitions as they begin to unfold, especially when one group gradually changes color patterns across multiple timeframes.
How Heatmap Tools Display Market Data
Heatmaps organize securities into structured categories, commonly starting with major sectors and then dividing into industries or sub-industries. Each rectangle within the map corresponds to an individual company or exchange-traded fund. The visual design assigns different colors to price changes over a chosen timeframe, such as intraday, weekly, monthly, or year-to-date performance.
Green shades generally represent price increases, while red shades indicate declines. Neutral colors may be used to reflect minimal movement. Darker tones usually correspond to larger percentage changes, allowing stronger trends to stand out immediately. Because block size often reflects market capitalization, large companies occupy more prominent positions within each sector. This proportional representation ensures that widely held firms have visual weight consistent with their influence on indexes.
The layout typically clusters related businesses together. For example, within the technology sector, software, semiconductors, and hardware manufacturers may appear as subcategories. This nested structure helps users identify whether strength is broad-based or limited to specific industries.
Reading Color Distribution and Pattern Recognition
Interpreting a heatmap requires observing more than isolated blocks. A single company showing strong performance may reflect firm-specific news rather than sector-wide rotation. Broader patterns are more relevant. When most companies within a sector display consistent color signals, this alignment suggests collective movement.
If an entire sector appears in darker green tones over a multi-week timeframe while others remain mixed, the pattern may signal sustained inflows. Conversely, a sector dominated by red shading could indicate persistent selling pressure. The visual clustering allows investors to detect these distributions quickly, reducing the need for manual calculations.
Another useful approach involves comparing adjacent sectors. For example, if consumer discretionary stocks show gains while consumer staples display losses, this contrast may indicate a shift toward growth-oriented risk exposure. Heatmaps reveal these contrasts through both color intensity and spatial arrangement.
Identifying Relative Strength Across Sectors
Relative strength refers to the performance of one asset compared to another, often measured against a broader index. In the context of sector rotation, it involves determining whether a sector is outperforming or underperforming the general market. Heatmaps provide an initial visual cue by highlighting widespread consistency in price movements.
When evaluating relative strength, investors often compare multiple timeframes. A sector leading on a one-day map may not sustain that advantage over a month or quarter. By adjusting time filters, users can differentiate between short-term volatility and longer-term leadership. A pattern of leadership across several periods may indicate institutional positioning rather than temporary activity.
Consistency matters. If a sector repeatedly appears among the strongest performers across rolling weekly views, this persistence strengthens the case for rotation. Heatmaps serve as a screening tool, drawing attention to areas that merit deeper quantitative analysis.
Comparing Sector Performance to Market Indexes
Heatmap observations gain additional meaning when compared to benchmark indexes such as the S&P 500 or other broad market composites. A strong color presence in one sector may coincide with overall market gains, but the degree of participation provides valuable insight. If most sectors move in the same direction, the trend may represent a general market rally. If only one or two sectors show concentrated strength while the majority remain neutral or negative, targeted rotation is more likely.
Relative outperformance occurs when a sector advances at a faster rate than the benchmark, or declines less during downturns. Some analytical tools allow side-by-side comparison of sector exchange-traded funds against indexes, helping confirm impressions derived from heatmaps. For example, if technology stocks appear broadly green while the index shows muted gains, overlaying performance charts can quantify the difference.
This layered analysis distinguishes between widespread optimism and selective capital allocation. Understanding the distinction assists portfolio managers in adjusting exposure responsibly.
Tracking Rotation Over Time
Sector rotation typically unfolds gradually. Early signs may be subtle, with color shifts appearing first in shorter timeframes. Over successive weeks, these changes can expand into longer-term views. Monitoring archived heatmaps or cycling through historical periods allows investors to observe this evolution.
For instance, defensive sectors may begin to show modest strength during isolated sessions. If that strength persists while growth-oriented groups weaken, the broader trend may reflect changing economic expectations. Similarly, renewed strength in cyclical sectors after a downturn could indicate improving confidence in future growth.
Because markets anticipate economic developments, heatmaps can display rotation before official economic statistics confirm shifts. While such signals should not be interpreted in isolation, they provide early visual clues about capital movement.
Using Heatmaps Alongside Other Indicators
Although heatmaps offer an efficient overview, they represent only one dimension of analysis. Price change alone does not explain underlying causes. Volume data helps determine whether moves are supported by significant participation. Rising prices accompanied by increasing trading volume may suggest stronger conviction than price changes on light volume.
Technical indicators such as relative strength indexes, moving averages, or momentum oscillators can clarify whether sectors are trending or overextended. Fundamental indicators, including earnings growth, valuation ratios, and revenue projections, provide context for sustainability. Macroeconomic data, such as employment figures, inflation metrics, and central bank policy statements, further explain why certain industries attract attention.
Heatmaps indicate where movement is occurring. Complementary research explains why it may be occurring and whether the trend aligns with broader structural developments.
Practical Application in Portfolio Management
Portfolio managers and individual investors use heatmaps as part of routine market review. The ability to scan hundreds of securities simultaneously supports timely decision-making. If allocations remain concentrated in sectors that consistently underperform across multiple timeframes, managers may evaluate whether rebalancing is appropriate.
Rebalancing does not necessarily involve abandoning weaker sectors entirely. Instead, exposure might be adjusted incrementally to reflect changing leadership patterns. Risk management considerations also influence decisions. Increasing allocation to a leading sector may raise concentration risk if capital becomes overly focused in one area.
Heatmaps also assist in maintaining diversification. A portfolio that appears diversified by security count may in fact be concentrated in a small number of related industries. Visual clustering reveals these concentrations more clearly than reviewing a list of holdings.
Limitations and Interpretation Considerations
Despite their advantages, heatmaps have limitations. They present data at a fixed point in time, meaning rapid intraday changes may alter patterns quickly. Short-term maps can reflect noise rather than meaningful shifts. Without reference to broader context, users may misinterpret temporary fluctuations as evidence of rotation.
Market capitalization weighting may also influence perception. Large companies dominate visual space, potentially overshadowing smaller firms that are experiencing significant performance changes. Additionally, color scales differ across platforms, which can affect interpretation if thresholds are not clearly defined.
Sector classifications themselves vary depending on the indexing methodology used. A company categorized as technology in one system may appear differently in another. Understanding the classification structure behind a heatmap ensures accurate analysis.
Developing a Systematic Approach
Investors seeking to incorporate heatmaps into their workflow typically establish a consistent review process. This may involve examining daily performance to monitor short-term pressure, weekly views to identify emerging trends, and monthly or quarterly comparisons to assess sustained leadership. Recording observations over time creates a reference framework for interpreting new developments.
Combining visual inspection with quantitative metrics strengthens decision-making discipline. Rather than reacting to isolated color changes, systematic users confirm trends through objective measurement. This integrated method reduces the likelihood of overemphasizing isolated movements.
When applied consistently, heatmap tools support structured analysis of sector rotation. They condense extensive market information into an accessible format, highlight comparative performance patterns, and facilitate alignment between portfolio structure and prevailing economic conditions. While not a substitute for comprehensive research, they provide a practical starting point for monitoring capital flows and identifying changes in market leadership.