How to Use Heatmap Tools to Understand Sector Rotation
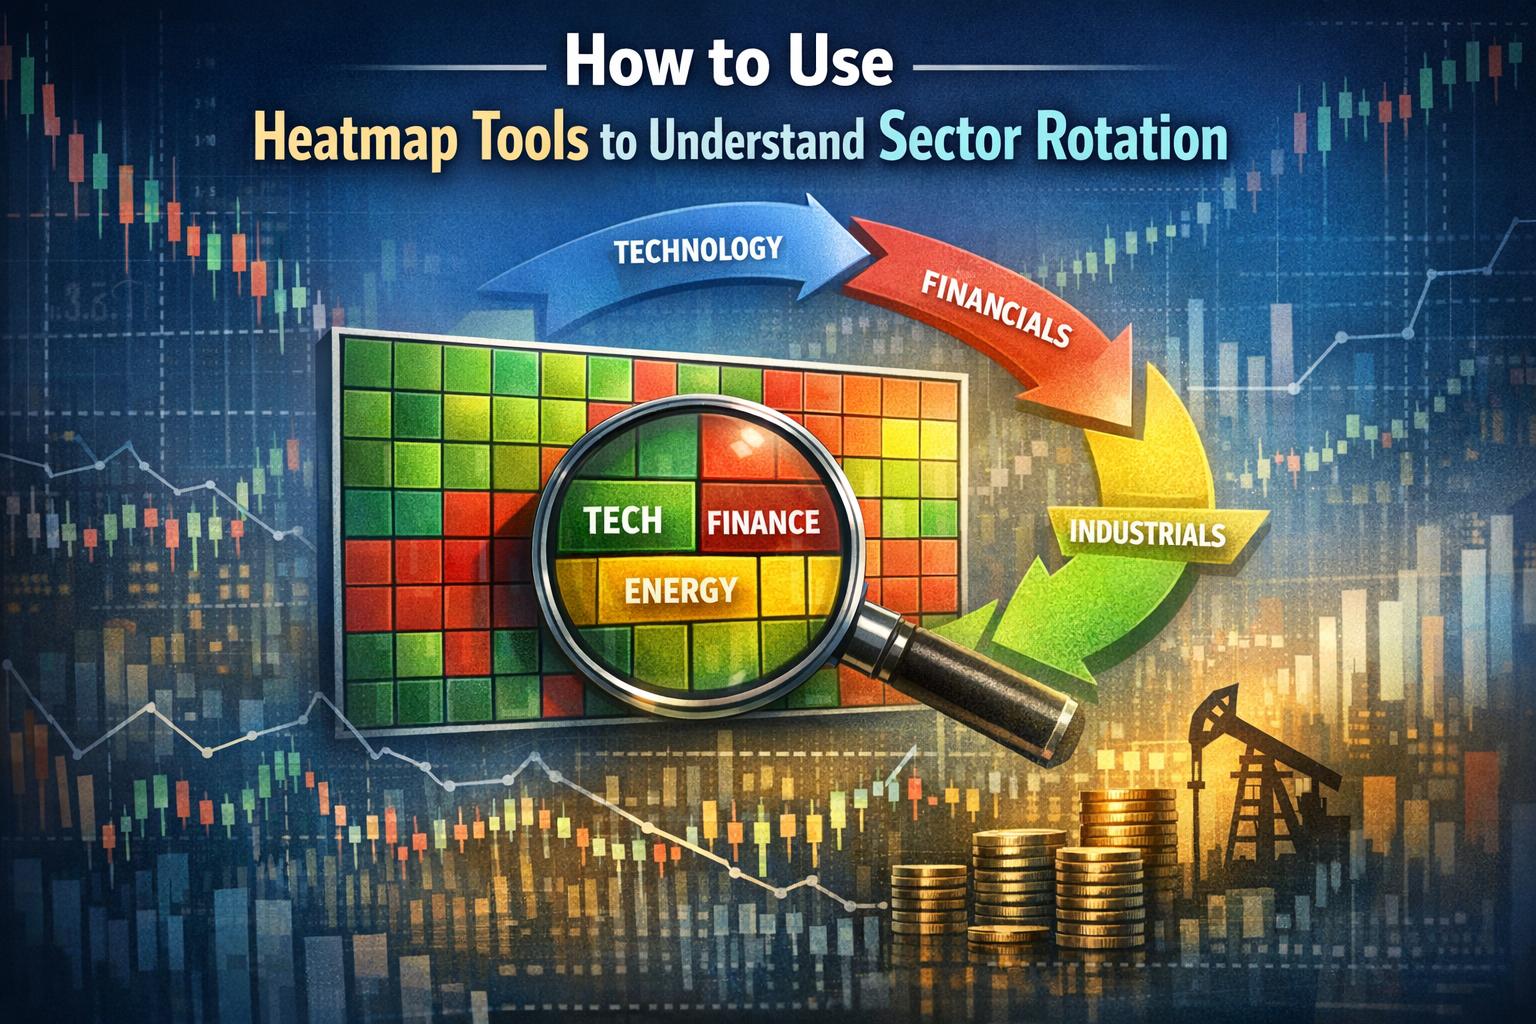
Heatmap tools provide a visual summary of market performance by displaying securities or sectors as colored blocks. The size of each block usually represents market capitalization, while the color indicates performance over a selected period. Investors use these tools to identify patterns in sector rotation, which refers to the movement of capital from one sector…