
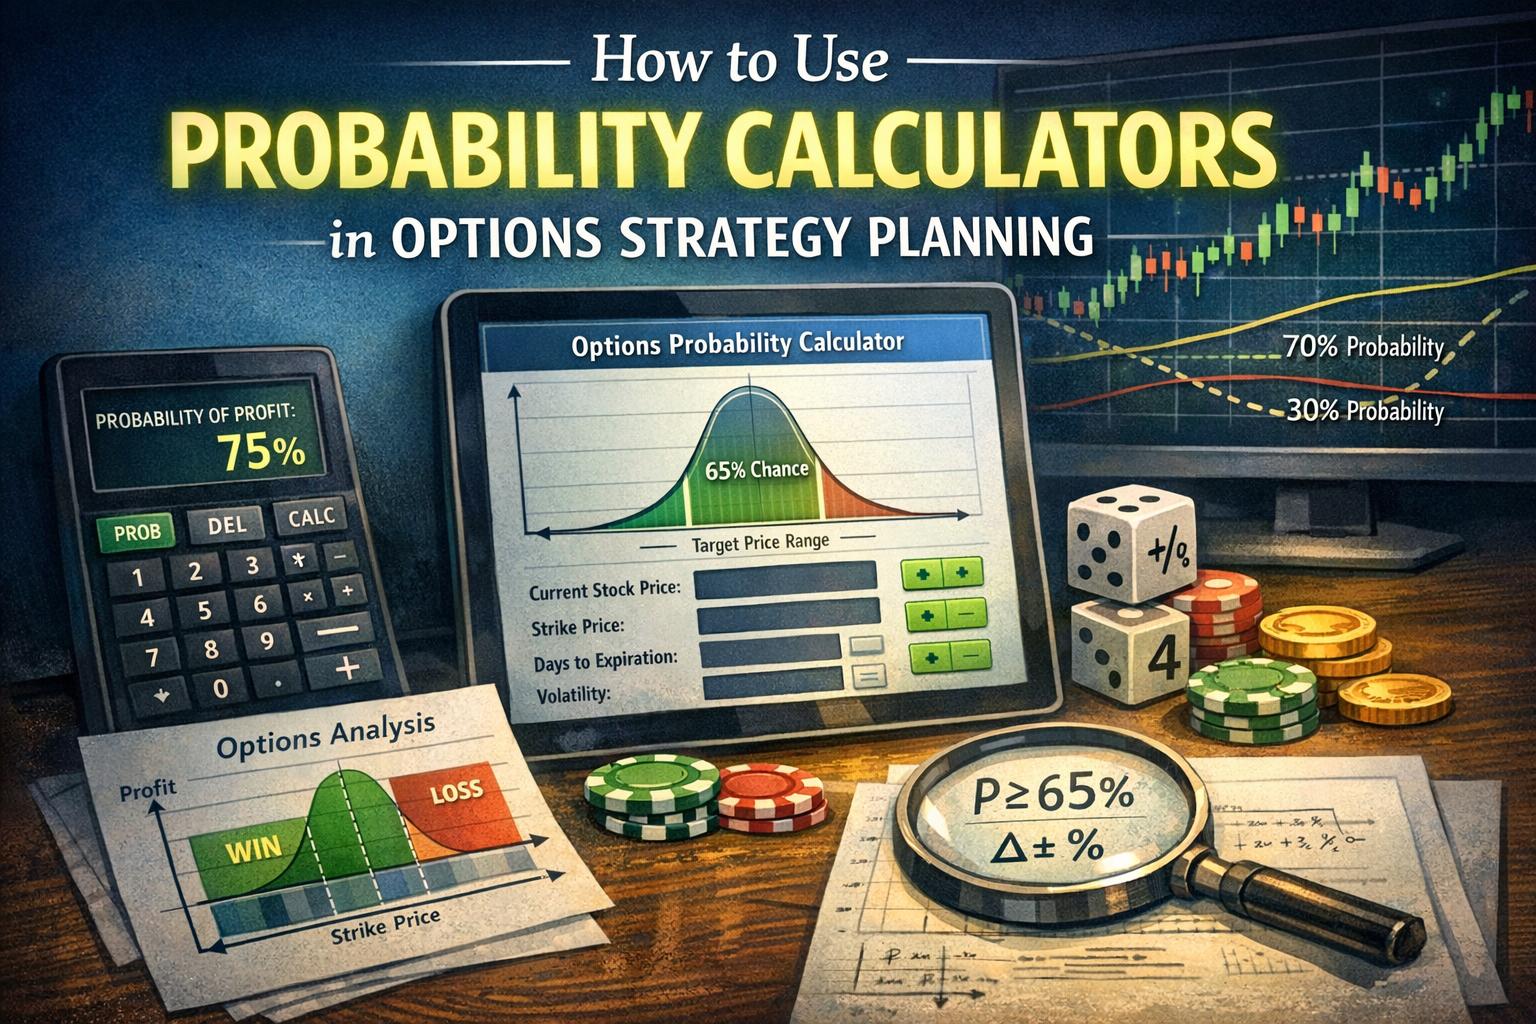
Probability calculators are analytical tools used by options traders to estimate the likelihood that a specific price event will occur before expiration. These tools translate market inputs such as implied volatility, time to expiration, strike price, underlying price, and interest rates into statistical estimates. When used correctly, they support structured decision-making and improve the consistency of options strategy planning. Rather than predicting exact price outcomes, probability calculators quantify ranges of potential outcomes and assign likelihoods based on accepted pricing models and volatility assumptions.
In modern derivatives markets, where pricing incorporates forward-looking expectations, probability-based analysis provides a framework for evaluating whether the premium of an option fairly reflects anticipated movement. By converting abstract volatility statistics into measurable probabilities, traders can compare strategies under consistent assumptions. This quantitative perspective reduces reliance on intuition and allows options positions to be evaluated according to defined statistical parameters.
Understanding Probability in Options Trading
Options pricing models, including the Black–Scholes framework and its variations, rely on probability distributions to estimate the likelihood that an option will expire in the money. These models assume that asset returns follow a lognormal distribution and that price fluctuations can be characterized by volatility and time. Probability calculators use these mathematical assumptions to generate practical trading metrics, such as probability of profit (POP), probability of expiring in the money (ITM), probability of expiring out of the money (OTM), and probability of touching a specific strike before expiration.
The distinction between these probability measures is significant. The probability of expiring in the money reflects the chance that the option’s intrinsic value will be positive at expiration. In contrast, probability of profit accounts for the net effect of premium paid or received. For example, an option may expire in the money but still produce a net loss if the premium paid was substantial. Probability calculators incorporate breakeven levels to provide a more trade-specific assessment.
These probabilities are derived primarily from implied volatility, which represents market expectations of future price movement over the life of the option. Implied volatility is embedded in option prices and fluctuates with supply, demand, and anticipated uncertainty. When implied volatility rises, the modeled probability of wide price swings increases. As a result, the likelihood of extreme outcomes becomes greater, influencing both buyers and sellers of options.
The Role of Implied Volatility
Implied volatility is central to probability estimation. Unlike historical volatility, which measures past price dispersion, implied volatility reflects forward-looking consensus. Probability calculators use this input to approximate a standard deviation of expected returns over a specified time horizon. This statistical framework allows the calculation of ranges within which the underlying asset is expected to trade.
When volatility expands, the distribution of expected prices widens. This expansion increases the probability that far out-of-the-money strikes may be reached. Conversely, declining implied volatility compresses the expected range, reducing the modeled likelihood of large directional moves. Understanding this dynamic allows traders to evaluate whether options are priced in alignment with expected variability.
Key Metrics Provided by Probability Calculators
Probability calculators present several interconnected metrics that support strategy evaluation. Probability of profit estimates the likelihood that a position will yield a net gain if held to expiration. This metric integrates the option premium, strike selection, and volatility assumptions. For sellers of options, POP often reflects a statistical edge derived from receiving premium beyond the expected move.
Delta, another commonly cited metric, measures the sensitivity of an option’s price to changes in the underlying asset. While delta is primarily a measure of price responsiveness, it is frequently interpreted as an approximation of the probability that the option will finish in the money. For example, an option with a delta of 0.30 is often considered to have approximately a 30 percent chance of expiring in the money under current assumptions. Though this interpretation is not exact, it provides a practical shortcut for gauging probability.
Advanced calculators also display gamma, theta, and vega, often referred to as the Greeks. While these are not probability metrics themselves, they affect how probability profiles evolve. Gamma measures the rate of change of delta, influencing how probability shifts after price movements. Theta quantifies time decay, altering profit probabilities as expiration approaches. Vega measures sensitivity to volatility changes, which directly modifies expected distributions.
Probability of Touching
An additional metric often displayed is the probability of touching a strike prior to expiration. Statistical analysis shows that under certain assumptions, the probability of touching a strike can be approximately twice the probability of expiring at that strike in the money. This metric is particularly relevant for traders who plan to manage trades dynamically rather than hold positions until expiration. If a trader intends to exit upon reaching a target price, understanding the likelihood of the underlying asset touching that level is critical.
Probability of touching highlights the distinction between path-dependent and expiration-based outcomes. Even if the final settlement price remains within a predicted range, temporary movements may create opportunities or risks during the life of the trade. Calculators that incorporate this metric allow for more nuanced scenario planning.
Applying Probability Calculators to Strategy Selection
When constructing an options strategy, traders use probability calculators to align strike placement and structure with market expectations and defined risk parameters. For example, a trader who anticipates relatively stable price action may examine the one-standard-deviation range and position short strikes outside that interval. By reviewing the model-generated probability that the underlying will remain within the defined bounds, the trader can determine whether the projected likelihood satisfies predefined criteria.
In credit spread strategies, probability metrics often guide strike selection. A short vertical spread may be placed at a delta level corresponding to a targeted probability of expiring out of the money. The calculator helps quantify the trade-off between probability and premium received. Higher probability positions typically yield lower premium, while lower probability positions compensate with larger potential credit.
Directional traders use calculators differently. For long calls or puts, the focus may shift to whether the statistical probability of reaching a breakeven or profit target justifies the premium paid. By comparing potential payoff to probability of attainment, traders can approximate expected value. This approach integrates probability with risk-reward considerations rather than focusing solely on directional predictions.
Multi-Leg Strategy Modeling
Modern trading platforms frequently allow simulation of multi-leg strategies, including iron condors, butterflies, calendars, and diagonal spreads. Probability calculators aggregate the distribution of outcomes across all legs to produce an overall probability of profit and risk profile. This comprehensive modeling accounts for interactions between long and short options within the structure.
For example, an iron condor combines two credit spreads and benefits from price stabilization within a range. The probability calculator estimates the likelihood that the underlying asset will finish between the short strikes. Traders can adjust strike width and distance from the current price to optimize the balance between probability and maximum profit.
Using Standard Deviation and Expected Move
Probability calculators often express expected movement in terms of standard deviation. Under normal distribution assumptions, a one-standard-deviation move covers approximately 68 percent of potential outcomes, while a two-standard-deviation move encompasses roughly 95 percent. These reference points provide a statistical boundary for evaluating strike placement.
The expected move represents the market-implied range of price fluctuation over a specified time frame. It can be derived from implied volatility and time to expiration using standard deviation formulas. Traders rely on this value to assess whether short option premiums sufficiently compensate for projected risk or whether long option positions are priced efficiently relative to anticipated movement.
Importantly, these calculations assume stable volatility and lognormal return distributions. While real-world price paths may deviate, standard deviation remains a widely accepted reference for structuring positions systematically. Consistent use of expected move data supports disciplined strike selection and promotes comparability across different underlying assets.
Time Decay and Probability Evolution
Probability is not static throughout the life of an option. As time passes, the influence of time decay alters the likelihood of various outcomes. Theta gradually reduces the value of extrinsic premium, affecting both buyers and sellers. Probability calculators update continuously to reflect diminishing time to expiration.
As expiration approaches, the distribution of potential outcomes narrows, assuming volatility remains constant. This compression often increases the probability that short out-of-the-money options will expire worthless if price remains stable. Conversely, sudden price movements late in the option’s life can rapidly shift modeled probabilities due to gamma effects. Traders who monitor updated probability metrics can adjust positions based on evolving risk exposure.
Limitations and Assumptions
Probability calculators rely on simplifying assumptions that may not capture all aspects of market behavior. The assumption of lognormal price distribution does not fully reflect skewness, kurtosis, or abrupt jumps observed in actual markets. Events such as earnings announcements, macroeconomic releases, or geopolitical developments can cause volatility expansions that deviate from modeled expectations.
Furthermore, implied volatility itself changes over time. A probability estimate generated at trade entry may become inaccurate if volatility rises or falls significantly. For example, a short premium strategy initiated during low volatility may experience reduced probability of profit if volatility subsequently increases.
Another limitation involves trade management. Probability of profit calculations typically assume that the position will be held until expiration. In practice, traders frequently close or adjust positions before expiration to manage risk. Such interventions alter realized outcomes and are not fully captured by a static expiration-based probability model.
Interpretation Considerations
Because probability outputs are derived from current market conditions, they should be interpreted as conditional estimates rather than forecasts. A 70 percent probability of profit does not guarantee success in any individual instance. Instead, it suggests that, under similar conditions and repeated occurrences, approximately 70 out of 100 comparable trades might be expected to yield profit before transaction costs.
Statistical variance plays a significant role. Short-term performance may diverge from long-term expectations due to random fluctuation. Effective application of probability therefore requires consistency and adequate sample size to align realized outcomes with modeled projections.
Integrating Probability into Risk Management
Effective options trading depends on aligning probability with risk-reward ratios and position sizing principles. A high-probability trade that offers limited return may expose the trader to unfavorable tail risk if losses from infrequent events outweigh accumulated gains. Probability calculators allow systematic comparison between candidate trades, enabling evaluation of both likelihood and magnitude of potential outcomes.
Risk management frameworks often incorporate maximum allocation thresholds, volatility filters, and predefined exit criteria. When probability metrics are integrated into these frameworks, strategy selection becomes more standardized. For instance, a trader may require that short option positions maintain a modeled probability of profit above a specified threshold while also limiting exposure per trade to a fixed percentage of capital.
Portfolio-level considerations further enhance the value of probability analysis. Evaluating correlations among positions, monitoring aggregate delta exposure, and assessing overall volatility sensitivity help ensure that individual high-probability trades do not collectively create concentrated risk. Probability calculators, when used alongside portfolio analytics, contribute to maintaining balanced exposure.
Conclusion
Probability calculators provide a structured approach to evaluating options strategies by translating volatility and time inputs into measurable likelihoods. They support informed decision-making by clarifying the statistical implications of strike selection, premium levels, and market expectations. Although these tools rely on assumptions that may not fully capture real-world complexity, consistent application enhances analytical discipline.
When integrated with risk management practices, position sizing rules, and an understanding of volatility dynamics, probability calculators contribute to a methodical options trading process. Their value lies not in predicting precise outcomes but in framing decisions within a quantitative context that can be applied consistently across varying market conditions.