Volatility measures the rate at which price changes over a given period. Rather than focusing solely on predicting direction, professional traders evaluate how far and how fast prices are likely to move. This distinction is important because a market may move in the expected direction but fail to generate sufficient range to justify the risk taken. By integrating volatility-based indicators into a trading plan, it becomes possible to structure entries around objective expansion signals, define realistic profit expectations, and establish risk limits that adapt to changing market conditions.
Markets alternate between periods of expansion and contraction. These shifts influence liquidity, spreads, order execution quality, and overall trade performance. A volatility-centered framework acknowledges that opportunity is not constant. Instead of applying the same entry and exit rules in all environments, traders can calibrate decisions based on measurable changes in price dispersion.
Understanding Volatility in Market Context
Volatility generally falls into two primary categories: historical volatility and implied volatility. Historical volatility reflects the magnitude of past price changes, calculated using statistical measures such as standard deviation of returns over a defined period. It is backward-looking and provides insight into how actively an asset has traded.
Implied volatility, by contrast, reflects market expectations of future price movement. It is derived from options pricing models and represents the level of variability implied by option premiums. Unlike historical volatility, which is descriptive, implied volatility is forward-looking and incorporates collective market sentiment regarding uncertainty.
These two forms of volatility often interact. When implied volatility exceeds historical levels by a significant margin, it may signal that market participants expect larger-than-average price swings. Conversely, when implied volatility trades below historical norms, expectations of future movement may be subdued.
Changes in volatility frequently precede broader structural transitions. Rising volatility may indicate growing disagreement among participants, increased reaction to macroeconomic data, or repositioning ahead of major events. Declining volatility often corresponds with equilibrium conditions, where supply and demand remain temporarily balanced within a defined price range. Recognizing these dynamics allows traders to adjust strategy selection accordingly.
Volatility Regimes and Market Structure
Financial markets tend to move through identifiable volatility regimes. In low-volatility regimes, price action is typically range-bound with smaller daily or intraday fluctuations. Trend-following strategies may struggle in such conditions because breakouts frequently fail to sustain follow-through. In contrast, high-volatility regimes can produce extended directional moves but also increased noise and intraday whipsaws.
Monitoring the transition between regimes is essential. A breakout from a compressed range often marks the shift from a contraction phase to an expansion phase. This transition is not random; it reflects changes in order flow and liquidity. Traders who anticipate regime changes can position themselves for momentum expansion rather than reacting after large portions of the move have already occurred.
Volatility indexes derived from broad market options provide an aggregated view of expected risk. While these indexes are more frequently applied to equity markets, similar concepts extend to currencies, commodities, and interest rate futures. Observing correlations between asset-level volatility and broader market indexes can offer insight into systemic risk conditions.
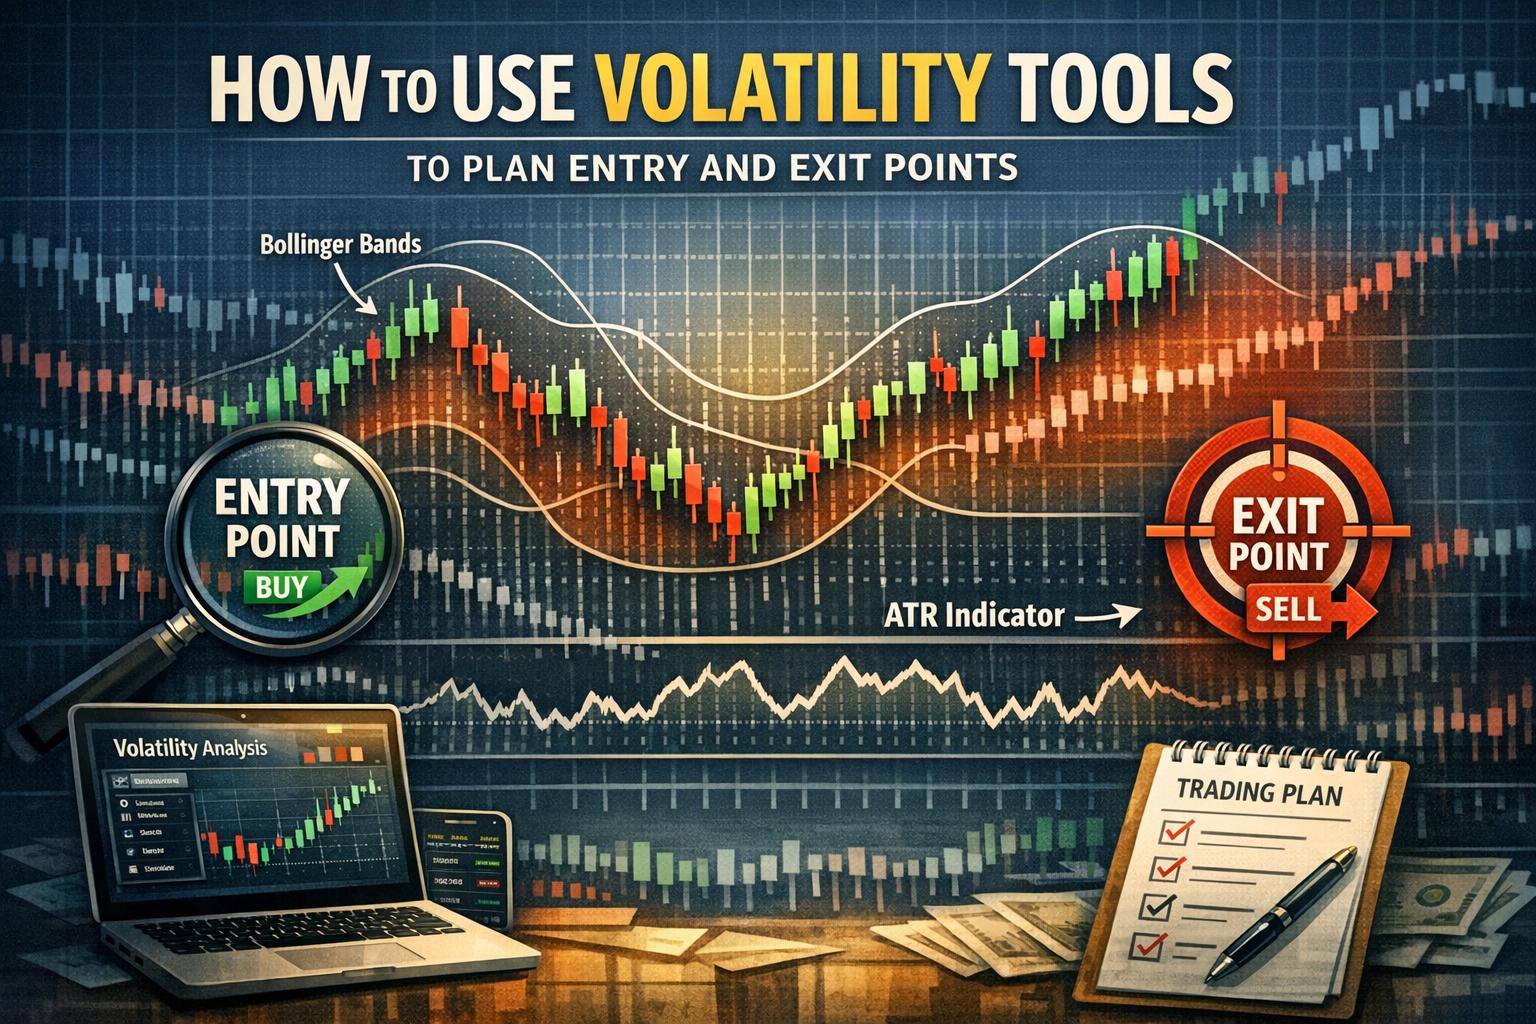
Using Average True Range (ATR) for Entry and Exit
The Average True Range (ATR) is one of the most widely used volatility indicators in technical analysis. Developed by J. Welles Wilder, the ATR calculates the average of the true range over a specified number of periods. The true range accounts not only for intraday high and low differences but also for gaps between sessions, providing a more comprehensive measure of price movement.
ATR does not provide directional signals. Instead, it quantifies the typical distance price travels within a period. This information is particularly useful for calibrating trade parameters. For entries, traders may monitor periods when ATR begins to expand following a contraction. An increase in ATR can confirm that price is moving beyond its recent equilibrium and may be entering a more active phase.
A common technique involves setting breakout thresholds relative to ATR. Rather than entering immediately when price exceeds a recent high, a trader might require the breakout distance to surpass a fraction or multiple of the current ATR. This filter reduces the likelihood of reacting to minor fluctuations that occur within normal volatility.
Exit management becomes more systematic when ATR is incorporated into stop placement. Fixed stop distances may not reflect actual market conditions. For instance, a static 20-point stop may be too tight in one market and excessively wide in another. By placing stops at 1.5 or 2 times the ATR, the stop adjusts dynamically to prevailing conditions. As volatility increases, the stop widens to accommodate normal variation; as volatility decreases, it tightens accordingly.
ATR is also useful for trailing stops. After a favorable move, progressively recalculating stop levels based on updated ATR values allows protection of gains while maintaining sufficient room for continuation. This approach reduces premature exits during sustained trending phases.
Bollinger Bands for Volatility Contraction and Expansion
Bollinger Bands combine a moving average with upper and lower bands plotted at a specified number of standard deviations from that average. Because standard deviation measures dispersion, the bands naturally widen when volatility increases and narrow when volatility decreases.
Periods of band contraction, often referred to as volatility squeezes, indicate that price variability has diminished relative to its recent history. These compressed phases frequently precede expansion, although direction remains uncertain. Traders monitoring such conditions may prepare conditional entry orders above and below the consolidation range, allowing market momentum to determine direction.
When bands begin expanding after a contraction, it signals increasing participation and widening price distribution. Traders may interpret a decisive close outside one of the bands, accompanied by expansion, as confirmation of a breakout. However, because price can temporarily penetrate a band without establishing a trend, combining this observation with volume analysis or support and resistance confirmation can improve reliability.
For exits, Bollinger Bands offer flexible reference points. In trending markets, price may consistently travel along the outer band. In such cases, exiting solely because price reaches the band may limit potential gains. Instead, traders might monitor reversion toward the moving average or narrowing bands as potential indications of momentum slowdown.
Historical Versus Implied Volatility in Options Markets
In derivatives markets, implied volatility directly influences option valuation through its role in pricing models such as Black–Scholes. An increase in implied volatility raises option premiums because the probability of larger price swings increases. Conversely, declining implied volatility compresses premiums.
Comparing implied volatility to its historical average provides context. When implied volatility is elevated relative to long-term norms, it suggests heightened uncertainty. Traders who expect this uncertainty to subside may structure strategies that benefit from declining volatility, such as premium-selling approaches. In contrast, when implied volatility is unusually low, strategies that benefit from expansion may be considered.
Entry timing often hinges on whether implied volatility is trending or mean-reverting. For example, entering a volatility-selling strategy while implied volatility is still rising may expose the position to continued premium expansion. Waiting for stabilization or early signs of reversal may align risk more effectively with expectations.
Understanding the relationship between volatility and time decay is also critical. Options lose value as expiration approaches, but the rate of decay interacts with implied volatility levels. In high-volatility environments, premiums may offset time decay for extended periods. In low-volatility conditions, time decay may dominate pricing behavior.
Combining Volatility With Price Structure
Volatility indicators become more robust when interpreted within the context of price structure. Support and resistance levels represent areas where supply and demand have historically interacted. A breakout above resistance accompanied by rising ATR or expanding Bollinger Bands suggests that the breakout is supported by increased participation.
Conversely, if price approaches resistance while volatility contracts, it may signal hesitation rather than momentum. In such cases, the probability of false breakouts may increase. Integrating volatility measures with structural analysis helps filter signals that would otherwise appear valid in isolation.
Trend analysis also benefits from volatility perspective. Sustained trends often demonstrate an initial surge in volatility followed by stabilization at moderately elevated levels. A sudden spike in volatility against the prevailing trend may indicate distribution or early stages of reversal. Monitoring these shifts allows traders to reduce exposure or tighten risk parameters before structural breakdown becomes evident.
Position Sizing Based on Volatility
Position sizing is a central component of risk management. Volatility-adjusted sizing ensures that exposure remains consistent relative to expected price fluctuations. When volatility is high, the same position size implies greater potential variation in account equity. Reducing size in such conditions maintains stable risk per trade.
One approach calculates position size by dividing a predetermined account risk percentage by the product of ATR and contract value. This formula aligns dollar risk with actual market movement rather than arbitrary point values. Over time, volatility-adjusted sizing can reduce performance variability caused by inconsistent trade exposure.
This methodology also supports cross-asset diversification. Assets with differing volatility profiles can be weighted so that each contributes proportionally to overall risk. Without such adjustment, highly volatile instruments may dominate portfolio behavior.
Limitations and Practical Considerations
While volatility-based indicators provide objective measurements, they remain derived from historical data and therefore lag current developments to some degree. Sudden news events or liquidity shocks may immediately alter volatility conditions beyond modeled expectations. As a result, volatility tools should complement, not replace, broader situational awareness.
Parameter selection also influences results. Shorter ATR or Bollinger Band periods respond quickly to change but may generate noise. Longer periods smooth fluctuations but react more slowly. Maintaining consistent parameters across similar market conditions allows for more reliable evaluation of performance.
Backtesting volatility-based rules across different instruments and timeframes can provide statistical grounding. However, forward monitoring in live or simulated conditions helps assess how tools perform during evolving market regimes that differ from historical samples.
Integrating Volatility-Based Entries and Exits Into a Trading Plan
A structured plan incorporating volatility-based entries and exits defines criteria for identifying contraction, confirming expansion, setting dynamic stops, and adjusting position size. Rather than treating each trade independently, the trader applies consistent metrics to evaluate opportunity and risk.
Such integration encourages discipline. Entries are triggered not solely by directional bias but by measurable expansion in price activity. Exits respond to changes in volatility that either support continuation or suggest deterioration of trade conditions. Over time, this alignment between market behavior and trade management can improve consistency.
Volatility does not eliminate uncertainty; instead, it quantifies it. By measuring how much markets are moving and adjusting tactics accordingly, traders anchor decisions to observable data rather than assumption. In variable and adaptive markets, this alignment between strategy and measurable price behavior forms a practical foundation for systematic trading operations.