
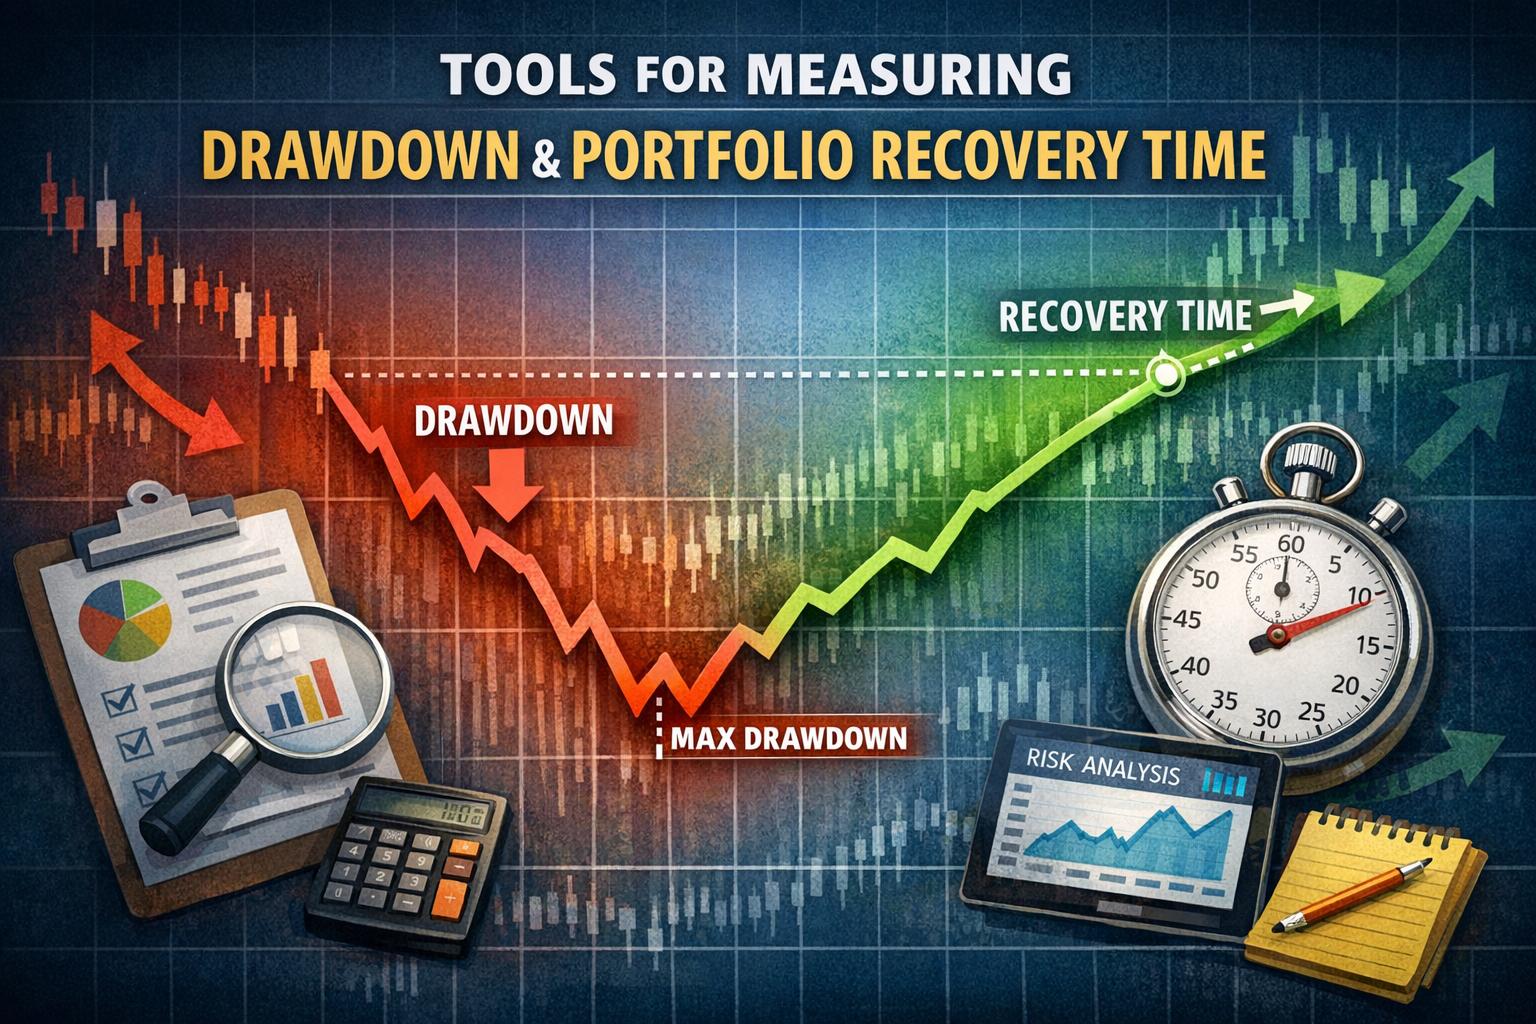
Drawdown and recovery time are central measures in portfolio risk analysis. They help investors evaluate not only the magnitude of a portfolio’s decline from a prior peak, but also the duration required to regain that lost value. While return metrics describe growth, drawdown metrics describe vulnerability. Together, they contribute to a more complete understanding of how a strategy behaves during adverse market conditions and how resilient it may be over full market cycles.
Unlike volatility, which reflects dispersion of returns around an average, drawdown measures the actual path of capital over time. Two portfolios with identical average returns and standard deviations can produce very different investor experiences if one suffers deeper or longer drawdowns. For this reason, drawdown analysis is widely incorporated into institutional reporting, manager due diligence, and internal risk controls.
Understanding Drawdown Metrics
Drawdown measures the percentage decline from a portfolio’s peak value to its lowest point before a new peak is achieved. At any given time, drawdown represents the gap between current value and the historical maximum observed up to that date. Because it is path-dependent, drawdown captures the cumulative impact of consecutive losses rather than isolating single-period declines.
The most frequently cited metric is maximum drawdown. This refers to the largest observed peak-to-trough decline over a defined time horizon. It provides a clear and intuitive measure of worst-case historical loss under actual market conditions. Analysts often compute maximum drawdown over rolling three-year, five-year, or ten-year windows to understand how downside exposure evolves across different cycles.
Maximum drawdown is calculated using cumulative return data. First, the running peak of portfolio value is determined at each observation date. Next, the percentage decline from that peak is computed. The most negative value in that series represents the maximum drawdown. While the calculation is straightforward, accurate measurement requires consistent pricing data, reinvestment of distributions, and clear treatment of asset flows.
Another important variation is rolling drawdown. Instead of focusing solely on the single worst event, rolling drawdown evaluates the largest peak-to-trough decline within moving time windows. For example, a three-year rolling drawdown series shows the worst loss investors could have experienced over any three-year span. This method highlights shifts in risk conditions and helps compare strategies on a more consistent temporal basis.
Average drawdown is also informative. It measures the mean of all drawdown periods during the evaluation horizon. While maximum drawdown focuses on severity, average drawdown reflects typical downside conditions. In combination, these metrics reveal whether a strategy tends to experience repeated moderate losses or rare but severe declines.
Drawdown analysis can be extended beyond the total portfolio level. Asset-level drawdowns reveal how individual holdings contribute to overall declines. Sector or factor-level drawdowns clarify which exposures drive risk during stress periods. This decomposition supports risk budgeting and allocation decisions, particularly in diversified or multi-asset portfolios.
Drawdown Duration and Recovery Time
Depth of decline is only one dimension of risk. Equally important is drawdown duration, which measures the length of time a portfolio remains below its previous high. Duration begins at the prior peak and ends only when that value is surpassed. The interval between these two points is often referred to as time under water.
Recovery time analyzes the final stage of this process. After a portfolio reaches its trough, the recovery period measures how long it takes to regain the previous peak. In some cases, the descent to the trough is brief but the recovery is prolonged. In others, losses accumulate gradually but rebound rapidly once stabilization begins. Evaluating both phases provides insight into structural resilience.
Long recovery periods can materially affect compounded returns. If capital remains below prior highs for extended intervals, the opportunity cost relative to alternative strategies increases. This is particularly relevant for portfolios that depend on compounding to meet long-term liabilities. Even moderate drawdowns can disrupt expected growth trajectories if recovery is slow.
Measuring duration requires identifying three distinct dates for each drawdown cycle: the initial peak, the trough, and the recovery point when the prior peak is exceeded. Analysts track each cycle separately and compute summary statistics such as average duration, maximum duration, and median time under water. These statistics allow comparison across managers and strategies with different market exposures.
Duration analysis is especially relevant for portfolios with external cash flow obligations. Pension funds, endowments, and retirement portfolios often require predictable distributions. A strategy that experiences extended recovery periods may impose higher liquidity pressure, even if its long-term return is competitive.
Risk-Adjusted Ratios Incorporating Drawdown
Recognizing that volatility alone does not capture the experience of sustained losses, several performance ratios explicitly incorporate drawdown measures. These ratios contextualize returns relative to downside exposure and provide a framework for comparing strategies that pursue absolute return objectives.
The Calmar Ratio divides annualized return by maximum drawdown. A higher value indicates that the strategy generates more return per unit of peak-to-trough loss. Because maximum drawdown reflects realized capital contraction, the Calmar Ratio emphasizes practical downside risk rather than statistical variation.
The Sterling Ratio refines this approach by replacing maximum drawdown with the average of several largest drawdowns. This adjustment reduces the influence of a single extreme event and reflects recurring patterns of loss. It is particularly useful when evaluating strategies with multiple cyclical downturns.
The Burke Ratio expands the framework further by incorporating the square root of the sum of squared drawdowns in its denominator. This method penalizes both frequency and magnitude of losses, creating a more continuous measure of downside persistence. Compared with volatility-based ratios such as the Sharpe Ratio, these drawdown-based metrics better align with investor concerns about capital preservation.
These ratios should be interpreted carefully. A strategy with low drawdown may also have lower expected return, leading to similar ratio values as a higher-return, higher-risk strategy. Therefore, ratio analysis is most informative when combined with qualitative assessment of strategy design, leverage, liquidity profile, and investment horizon.
Spreadsheet-Based Measurement
Independent analysts often calculate drawdown metrics using spreadsheet software. The process begins with a chronological series of portfolio values or cumulative returns. A running maximum column is constructed by identifying the highest value observed up to each date. The difference between the current value and the running maximum, expressed as a percentage of the maximum, yields the drawdown series.
Charts derived from this series display the full history of capital contraction and recovery. Troughs can be marked directly on the timeline, allowing visual identification of stress periods. Summary cells then compute the minimum drawdown value, average drawdown, and number of drawdown episodes.
Recovery time can be measured by tracking the number of periods between the trough date and the date when portfolio value exceeds the prior peak. Analysts may compute these durations in months, quarters, or trading days depending on data frequency. This method enables sensitivity testing, such as simulating alternative rebalancing frequencies or allocation mixes.
Spreadsheets also allow scenario modification. By adjusting return assumptions or reallocating exposure weights, analysts can observe how drawdown profiles change. Although spreadsheets lack the computational scale of specialized risk platforms, they offer transparency and flexibility that support thorough review.
Monte Carlo Simulation and Scenario Analysis
Historical data captures realized market events but does not represent all possible future sequences. To evaluate potential variability in drawdowns and recovery times, analysts often employ Monte Carlo simulation. This approach generates thousands of hypothetical return paths based on estimated statistical properties such as mean return, volatility, and correlation structure.
Each simulated path produces its own maximum drawdown and recovery duration. Aggregating results across simulations yields probability distributions for these metrics. Analysts can then estimate the likelihood that a portfolio experiences a drawdown exceeding a specified threshold or remains under water longer than a defined period.
Monte Carlo analysis can incorporate regime shifts by adjusting volatility assumptions or introducing serial correlation. For example, a higher-volatility regime increases both expected drawdown depth and typical recovery time. By testing multiple regimes, analysts obtain a more comprehensive view of structural vulnerability.
Scenario analysis complements simulation by examining specific historical episodes, such as financial crises or prolonged recessions. Portfolio returns can be stressed using observed asset behavior during these periods. The resulting drawdown and recovery estimates provide tangible reference points for risk tolerance discussions.
While simulation produces valuable probabilistic insights, it remains sensitive to input assumptions. Underestimation of correlation or volatility can materially reduce projected downside risk. Therefore, parameter estimation and validation are critical components of reliable modeling.
Drawdown in Multi-Asset and Diversified Portfolios
In diversified portfolios, drawdown behavior reflects interactions among asset classes. Correlation plays a central role. During stable periods, diversification may limit drawdown depth. However, in systemic crises correlations often rise, weakening diversification benefits and amplifying portfolio-level losses.
Asset allocation decisions directly influence recovery dynamics. Fixed income allocations may cushion equity declines and shorten recovery time, whereas concentrated equity exposure can produce deeper drawdowns but potentially faster rebounds if market recovery is strong. Alternative strategies, including managed futures or market-neutral approaches, may provide offsetting performance during equity stress, reducing both depth and duration.
Rebalancing policies also affect drawdown outcomes. Periodic rebalancing enforces discipline by reallocating capital toward underperforming assets. Over extended horizons, such discipline can moderate prolonged recovery periods. However, frequent rebalancing during persistent downturns may increase transaction costs and liquidity strain. Evaluating these effects requires analyzing both historical and simulated drawdown profiles under differing rebalancing rules.
Liquidity, Leverage, and Structural Considerations
Liquidity conditions influence both measured and realized drawdown. In highly liquid markets, price discovery occurs rapidly, and recovery may begin as soon as sentiment shifts. In less liquid assets, valuation adjustments may lag market stress, leading to understated interim drawdowns followed by abrupt corrections.
Leverage magnifies drawdown effects. Borrowed capital increases sensitivity to adverse price movements, often accelerating the pace of decline and extending recovery time due to compounding losses. Risk controls such as margin requirements or deleveraging thresholds can interrupt drawdown cycles but may also lock in losses if triggered during temporary volatility spikes.
Portfolio structure, including concentration limits and stop-loss mechanisms, shapes drawdown distribution. Tight concentration increases the risk of extreme events, whereas broad diversification spreads exposure but may dilute upside. Stop-loss rules can cap drawdown at predefined levels, yet they introduce path dependency and may result in repeated exit and re-entry costs.
Interpreting Results in Portfolio Context
Drawdown analysis gains relevance when aligned with investment objectives. Long-horizon investors with stable funding sources may tolerate deeper drawdowns if expected returns justify temporary declines. Conversely, investors with short horizons or high withdrawal needs may prioritize shorter recovery times over higher average returns.
Combining maximum drawdown, average drawdown, and duration metrics provides a layered risk assessment. Maximum drawdown highlights extreme exposure, average drawdown reflects typical adversity, and duration captures capital impairment over time. Evaluated together, they portray not just how much loss may occur, but how persistently that loss may affect compounding.
Importantly, drawdown metrics are backward-looking when based solely on historical data. Regular review ensures that structural changes in portfolio composition or market conditions are reflected in updated analysis. Consistent monitoring helps identify when evolving risks alter expected recovery dynamics.
Effective measurement of drawdown and recovery time requires accurate return data, clear methodology, and consistent interpretation. When integrated into formal review processes, these tools enhance transparency and support disciplined allocation decisions. By examining both magnitude and duration of capital decline, investors obtain a practical perspective on portfolio resilience that complements traditional statistical measures.